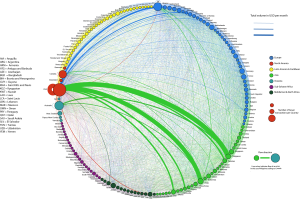
The online digital trade market is highly international: 89% of the trade measured by value happened between a client and a contractor who are in different countries. The network therefore attempts to illustrate the entirety of those international flows in one graph. It depicts countries as nodes (i.e. circles) and volumes of transactions between buyers and sellers in those countries as edges (i.e. the lines connecting countries). Country nodes are shaded according to the world region that they are in and sized according to the number of buyer transactions originating in them. Edges are colored according to the flow of services: with the line shaded as the color of the originating/selling region. Edges are also weighted according to the total volume of trade.
We see not just a complex many-to-many relationship of international trade, but also the large role that a few geographic relationships take (in particular, India and the Philippines selling to the United States). In other words, whilst (for many types of services) people and firms can buy and sell from almost anywhere (and indeed there are examples of most kinds of connection), in practice, some geographical relationships dominate.
Source: http://geonet.oii.ox.ac.uk/blog/mapping-the-geographies-of-digital-work/

